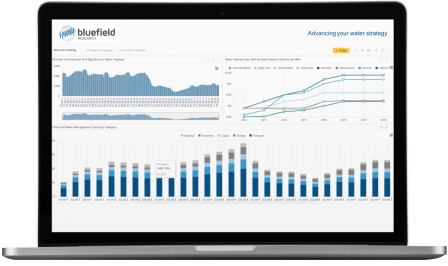
Heightened awareness and newly available sources of funding for municipal water and sewer infrastructure have set the stage for over US$104 billion of hardware and equipment investments by municipal utilities in the U.S.
This in-depth report provides in-depth analysis of U.S. municipal water & wastewater underground network CAPEX, market drivers & inhibitors, and key factors that could fundamentally affect investment going forward.
Key questions addressed:
- What factors are shaping new build, rehabilitation, and replacement?
- How will capital expenditures differ state-by-state?
- What are the pipe material and network hardware trends?
- How is inflation influencing network infrastructure forecasts?
 Municipal Water Data Navigator seat holders can
access related dashboard now
Report + Data Option:
Data is a key component to this analysis. Our team has compiled relevant data dashboards available as an add on purchase option. Select the “Report + Data” option in the drop down menu under Report Price.
Sample dashboards:
- Network equipment CAPEX (US$) by state
- CAPEX by municipal segment, by location, by project type
- Pipe equipment spend by material type and by diameter
- CAPEX by valve subtype
- Valve and manhole CAPEX by diameter
Report Scope
This Insight Report is an in-depth analysis of U.S. municipal water & wastewater network infrastructure capital expenditures (CAPEX) from 2022–2030. The outlook includes CAPEX by ten asset categories, and state analysis. Geographically, Bluefield has analyzed the markets in 50 U.S. states, and Washington D.C.
Bluefield’s forecast is supported by transparent methodology and assumptions that account for historical trends, growth in installed assets, regulatory drivers, and project-specific data to support critical assumptions. These key inputs are included in the report and weighted independently in the model to allow for a clear, yet nuanced, set of forecasts.
Table of Contents
Executive Summary
Myriad of market drivers and inhibitors shaping market outlook
Threads of higher growth categories emerge within mature market sector
Looking to the Future: Trends to Watch
Section 1: Drivers for Change in Water Distribution & Wastewater Collection network Infrastructure
1.1 COVID Shakes Up Market Landscape
1.2 Inflationary Pressures after Investment Outlook
1.3 Anticipating Climatic Events Mitigates Utility Risks Drought
1.4 Population, Demographic Shifts Signal Demand Changes
1.5 Aging Water & Wastewater Infrastructure & Deferred Investment
1.6 New Underground Network Additions Driven by Housing Starts
1.7 Infrastructure Moves Capital Investments Closer to Reality
1.8 Municipal Material Preferences, Procurement Policies Shape Market Opportunities
Section 2: Forecast Methodology & Assumptions
2.1 Bluefield Approach & Assumptions
2.2 Building on the Existing Asset Base
2.3 Calculating the Underlying Costs
2.4 Determining Rates of Change
2.5 Geographic Inputs Shape Variability
2.6 Diverging Material & Hardware Costs
2.7 Sowing Seeds for Greenfield Infrastructure
2.8 Replacement & Rehabilitation to Maintain Current System
Section 3: A Variable Market
3.1 Supply Chain Constraints Reflected in Underground Network Material Prices
3.2 Three Scenarios for Market Growth
Section 4: Waster Distribution & Wastewater Collection Network Forecasts
4.1 Forecast Overview
4.2 Forecast by Geography
4.3 Breaking Down the Outlook: Greenfield, Replacement & Rehabilitation
4.4 Water Distribution and Wastewater Collection Pipes and Fittings
4.5 Valve Types & Sizes
4.6 Manhole Market Outlook
4.7 Hydrant Market Outlook
Section 5: Looking to the Future
Housing Market Risks Loom
Changing Utility Budgets Impact Infrastructure Buildout
New Materials Reshape Footprint
Labor Constraints Drive Wage Escalation
Digital Impacts: Underground Network Asset Intelligence & Windows into the Network
List of Exhibits
Exhibit 1: Historic Investment Trends in Water & Wastewater Infrastructure
Exhibit 2: Sub-Segments of CAPEX Over Next Ten Years
Exhibit 3: Producer Price Indices for Water & Wastewater Infrastructure (January 2019-October 2021)
Exhibit 4: Billion-dollar Weather-related Disaster Trend, 1980-2020
Exhibit 5: Water Reuse Project Development in New York City Metropolitan Area
Exhibit 6: State Rural & Urban Population Percent Changes
Exhibit 7: Percent Change in City Resident Population, 2018 to 2019
Exhibit 8: Population Change in Resident Population, 2010-2020
Exhibit 9: Water Loss Auditing Programs by State
Exhibit 10: Age of Pipe Infrastructure by Region
Exhibit 11: New Privately Owned Units Authorized, 2019-2021
Exhibit 12: Housing Starts: Total, Privately Owned Housing Units January 2019-October 2021
Exhibit 13: Urban-Rural Splits by State
Exhibit 14: IIJA Water Infrastructure Spending
Exhibit 15: Installed Pipe Networks by Material Type by Region
Exhibit 16: Bluefield Forecast Methodology
Exhibit 17: Greenfield Infrastructure Inputs
Exhibit 18: Example of Region Replacement and Rehabilitation Inputs, Northeastern U.S.
Exhibit 19: Producer Price Indices for Water & Wastewater Infrastructure, October 2019-October 2021
Exhibit 20: Forecasted Spend on Water & Wastewater Network Equipment, 2020-2030
Exhibit 21: Total Water & Wastewater Network Expenditure Scenario Breakdown
Exhibit 22: Underground Network Infrastructure Spend, 2020-2030
Exhibit 23: Labor vs. Equipment Spend on Underground Network Assets
Exhibit 24: Ranking: Top Ten States by Equipment Spend, 2020-2030
Exhibit 25: Underground Network Asset Investment Forecast: Greenfield, Replacement & Rehabilitation
Exhibit 26: Pipe Equipment Spend by New, Replacement, and Rehabilitation
Exhibit 27: Pipe Equipment Spend by Material Types
Exhibit 28: Pipe Equipment Spend by Pipe Diameter
Exhibit 29: Pipe Fittings Equipment Spend
Exhibit 30: Butterfly, Plug, & Gate Valve Equipment Spend
Exhibit 31: Air Valve Equipment Spend
Exhibit 32: Manhole Equipment Spend by New, Replacement, and Rehabilitated Assets
Exhibit 33: Manhole Equipment Spend by Size
Exhibit 34: Hydrant Equipment Spend
Exhibit 35: Infrastructure Drivers
Exhibit 36: Year over Year Total U.S. CIP Spend (Published & Projected)
Exhibit 37: Historical Pipe Material Usage
Exhibit 38: U.S. Average Weekly Wage Water & Sewer System Construction

