Data on over 11,000 U.S. storm and climate impacts, right at your fingertips.
Bluefield has put together an interactive data set of 11,942 U.S. storm and climate impacts based on data from the National Ocean and Atmospheric Administration. This dataset quantifies the economic damages of these events and categorizes them by water and non-water events.
This data helps our clients address key questions:
- What is the breakdown of costs associated with the different types of U.S. storms and climate impacts from 2000 through 2023?
- Which events are classified as water-related versus non-water-related, and how many events fall into each category?
- Which U.S. states and regions have incurred the highest total damages?
Who has access to this U.S. Storm & Climate Impacts data?
All Bluefield Data Navigator seat holders can access this dataset.
Can I see how the economic damages have changed over time?
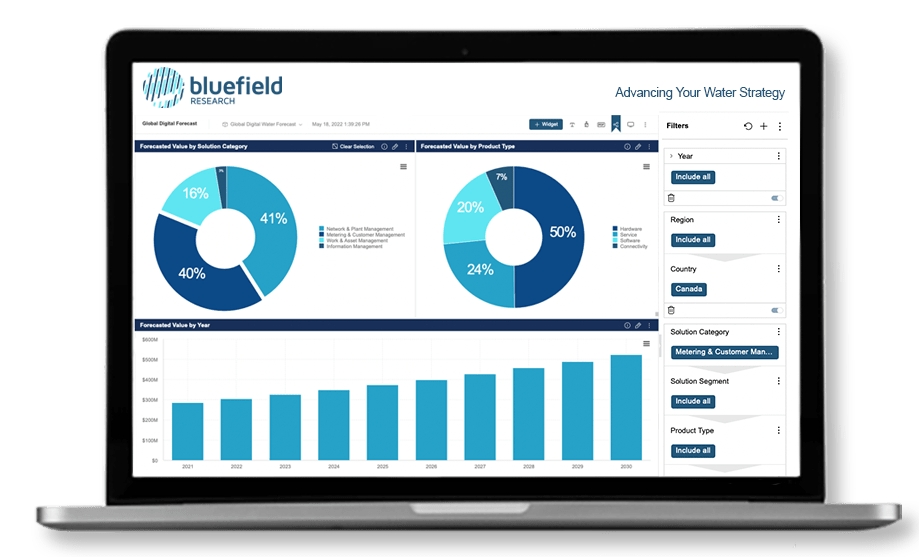
Yes. This data dashboard features a chart illustrating the cumulative economic damages over time from 2000 to 2023.
Do you include access to the raw data?
Yes. Our dashboard includes a data table featuring impacts by region, state, year, type of event, and a cost breakdown by agriculture damages, property damages, and total damages.
Become a Data Navigator Seat Holder
Talk to us about data access.

Worldwide Head of Development, AWS Water

