Desalination

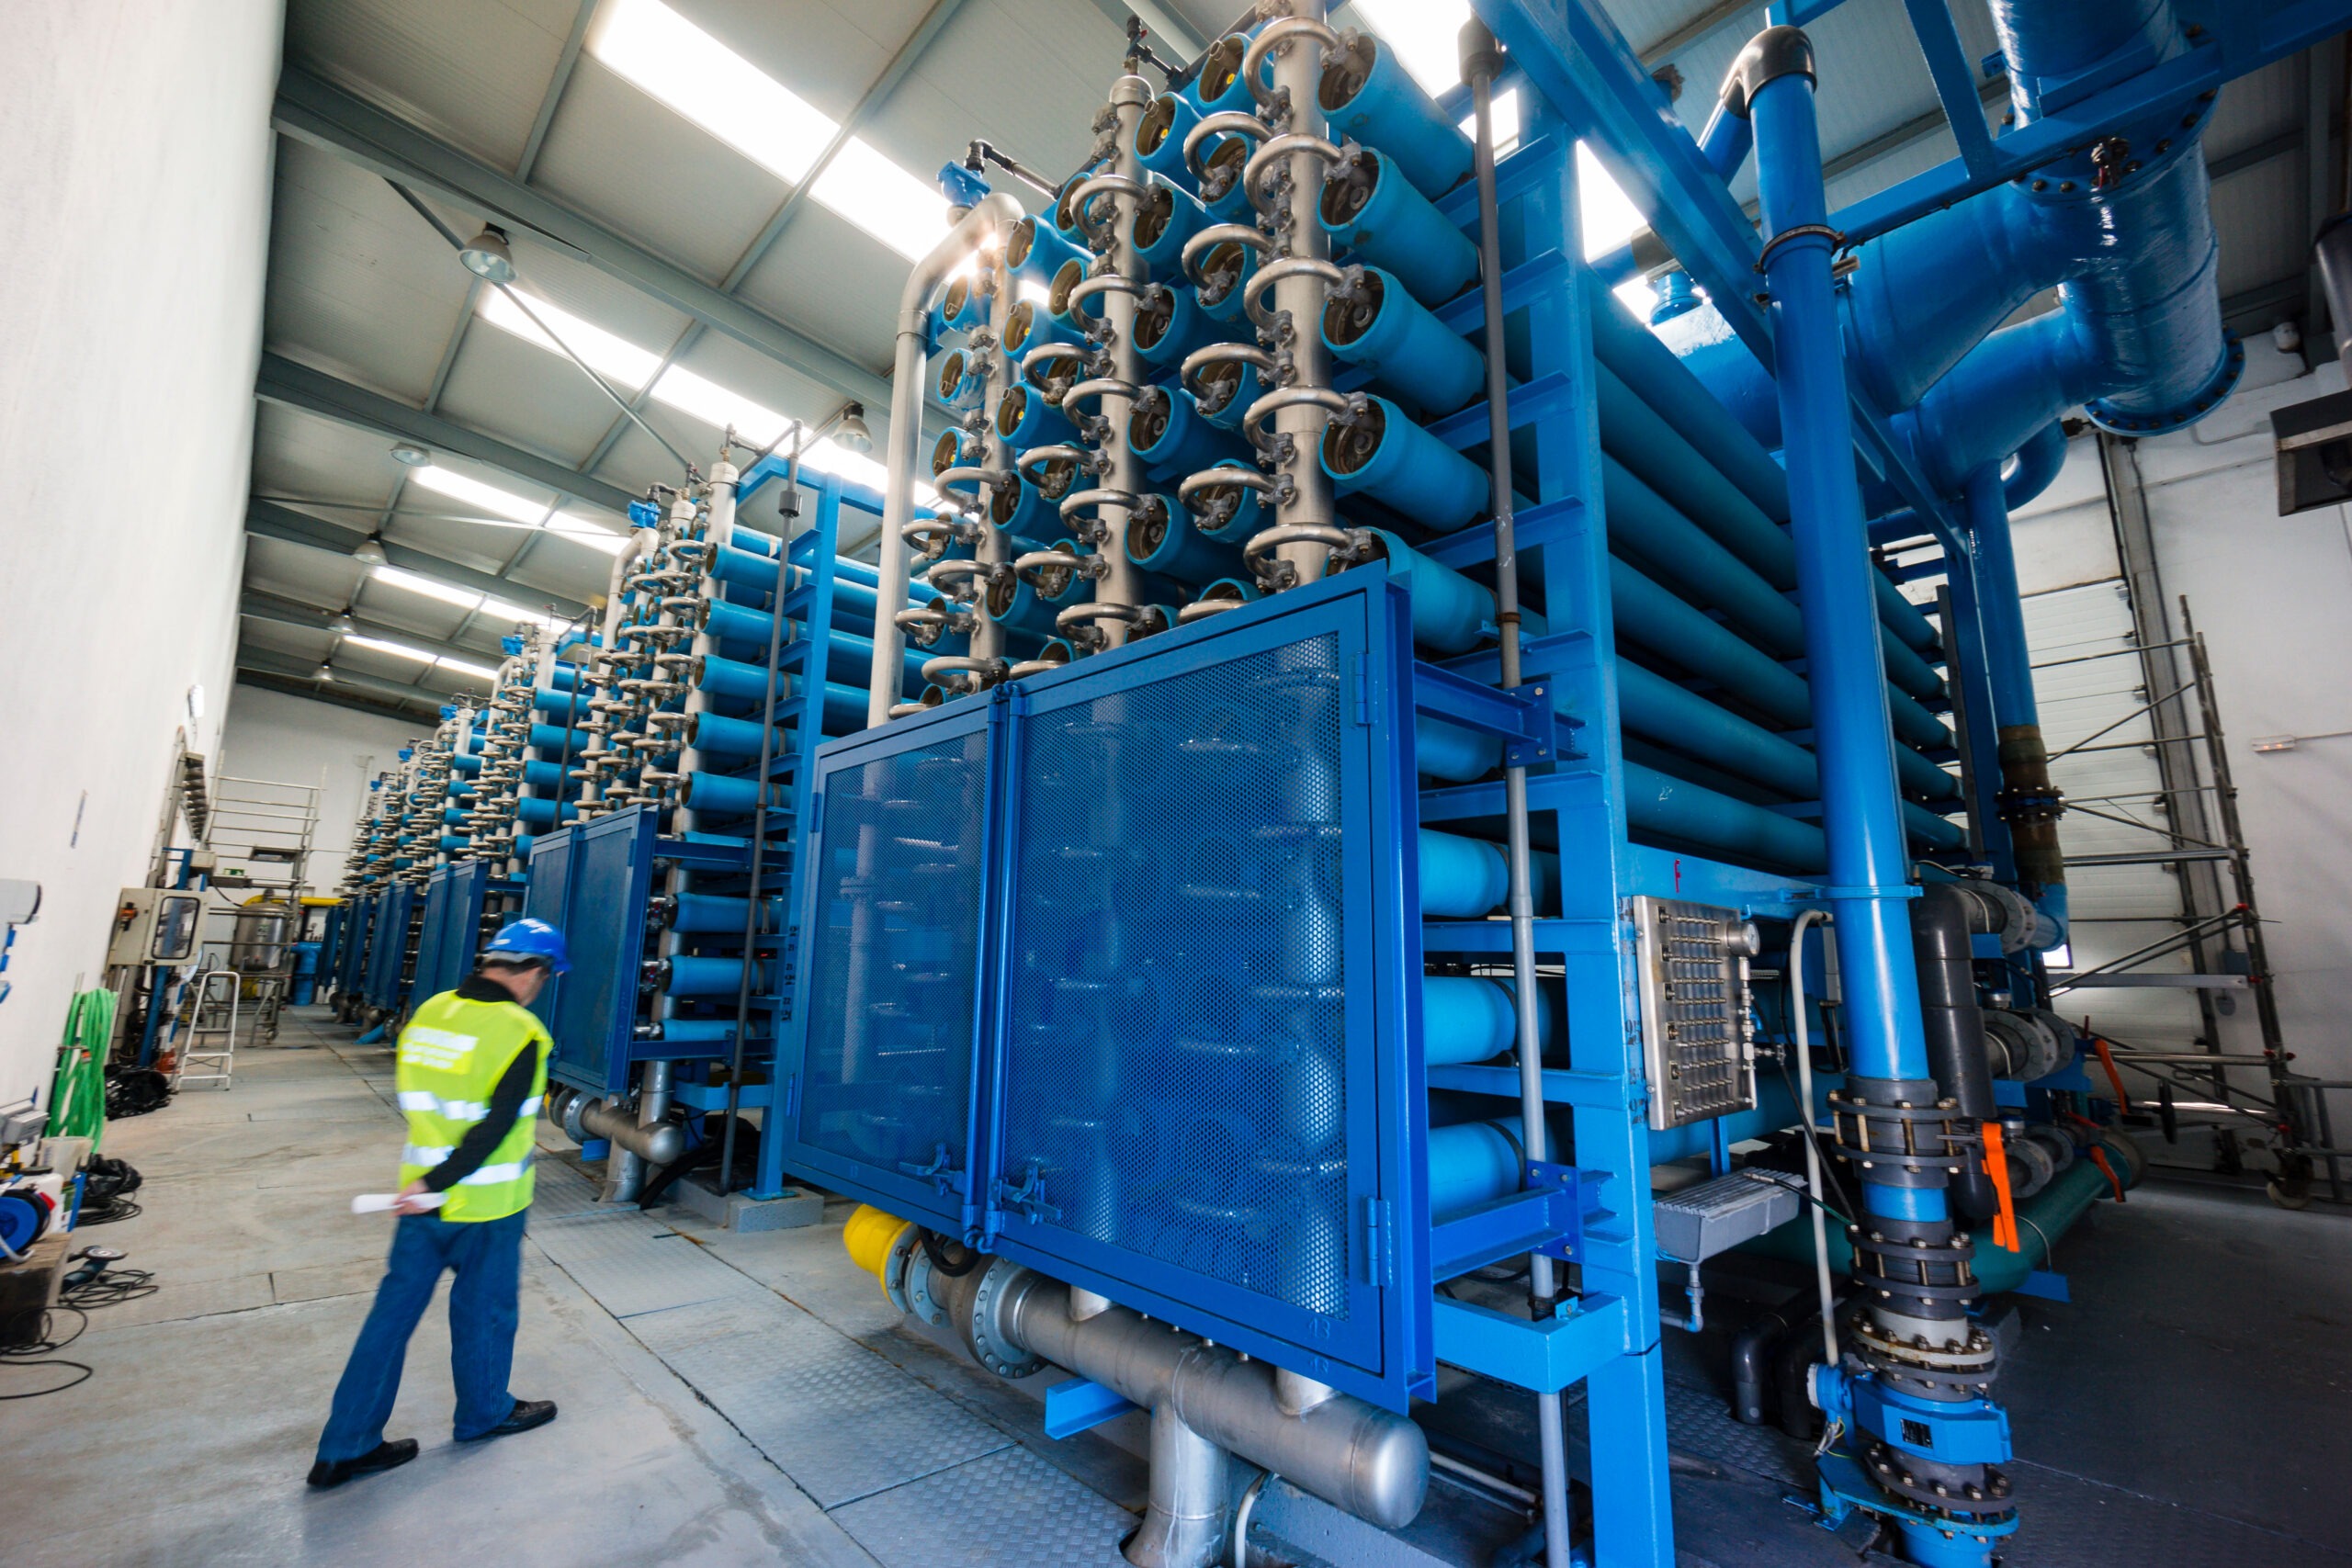
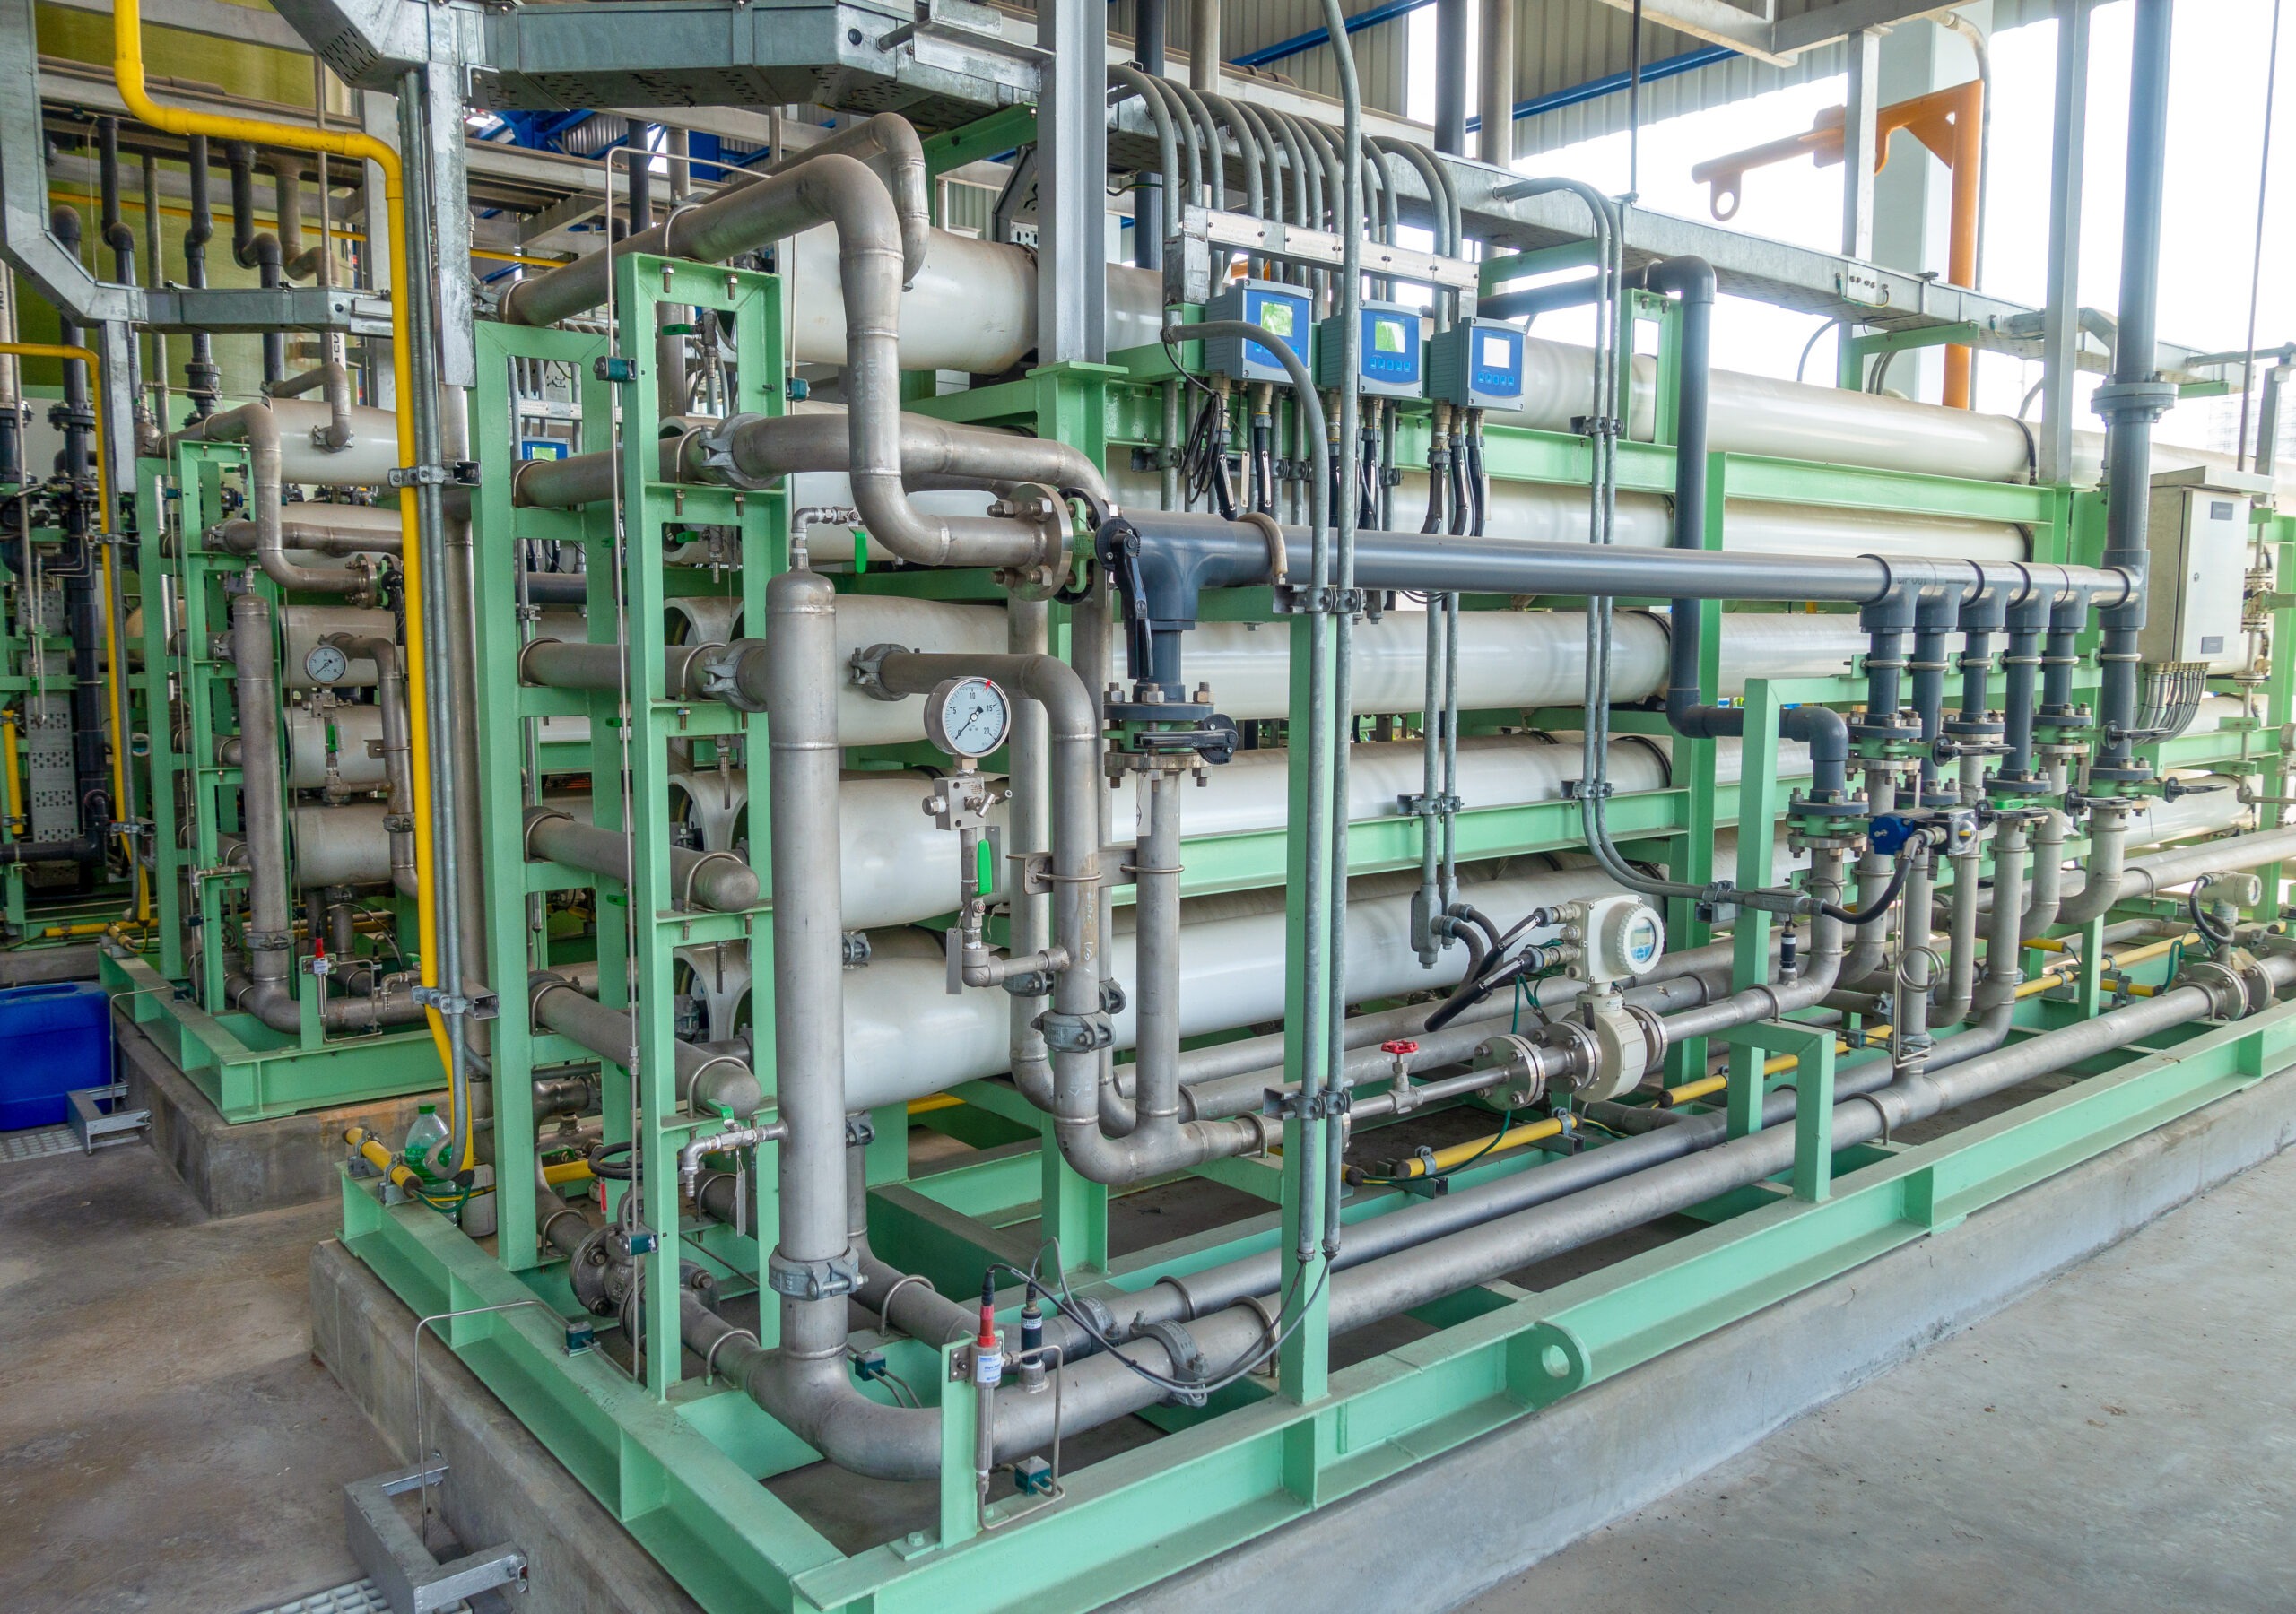
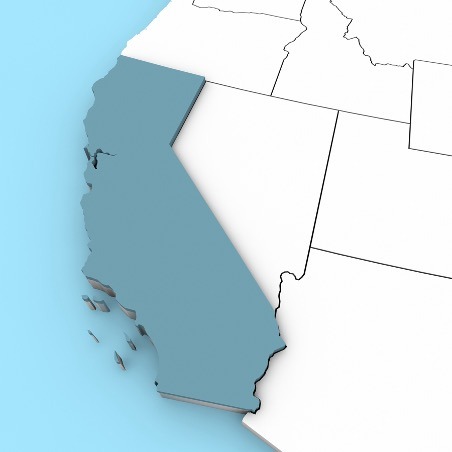
The global desalination market is undergoing significant change driven by more widespread competition for water by increasingly stressed utilities and industry verticals. Climate shifts are putting additional stress on existing water supplies in select markets like Australia, the western U.S., and Latin America. At the same time, baseload demand for water in the Middle East rises with population and industrial requirements.

Recent Analysis

Global Desalination: Market Share and Company Rankings

Catalonia Activates Multi-Pronged Drought Response

Water Management and Utility Impact across the Colorado River Basin

U.S. Desalination: Market Drivers, Trends, and Project Activity

Global Desalination: Market Trends, Ownership Rankings, and Forecast, 2022–2028

Water on Trial:

SCOTUS and the Clean Water Act

Harmful Algal Blooms:

Drinking Water Systems Impacts, Treatment Solutions, and Market Sizing

France PFAS Ban Advances Europe Remediation

EU Struggles to Enforce Wastewater Regulations While Expanding Scope

3M Windfall for Impacted PFAS Water Systems

Read more research on water quality

Key Research Questions

Who are the top owners of desalination globally?

What are the market drivers and inhibitors of desalination?

What is the cost of desalination compared to other water supplies?

Where are desalination projects located globally?

Desalination Data

60%

of global desalination capacity is located in Gulf countries

1%

of the world’s drinking water is supplied by desalination

300 million

people rely on desalinated water worldwide

1,030,000 cubic meters/day production capacity of Saudi Arabia’s Ras Al Khair, the world’s largest desalination plant

Talk to our water experts about desalination